
 Polaris
Business Intelligence on top of your ERP. We connect directly to Soft1 or Atlantis of EnterSoftOne and deliver the dashboards through Qlik Sense or Power BI, as you prefer.
Polaris for Soft1 · Polaris for Atlantis · Qlik Sense · Power BI
2
ERP of EnterSoftOne: Soft1 and Atlantis
2
BI tools of delivery: Qlik Sense and Power BI
17
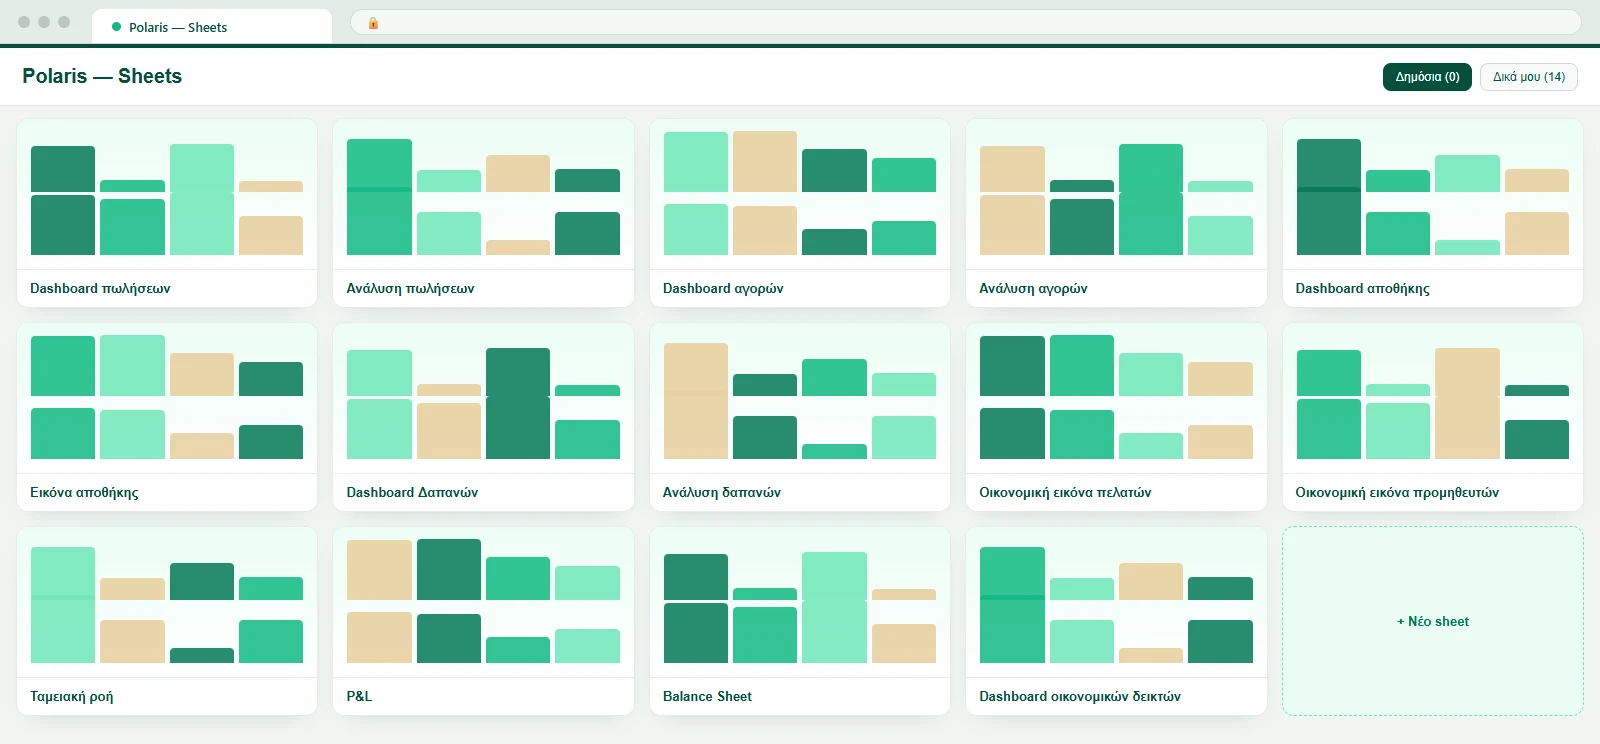
dashboards in Polaris
270+
indicators and metrics in Polaris
One Polaris, two ERP, two BI tools
Polaris is the general name of the solution. You choose the ERP you have and the BI tool you prefer, and you get the dashboards on the data of your business.
Each connector can deliver the data to both BI tools.
ERP
Soft1 ERPAtlantis ERPCore
UpCoreBI tool
Qlik SensePower BIThe branches of Polaris
Polaris for Soft1
For the Soft1 ERP of EnterSoftOne
For businesses that run the Soft1 ERP. The connector reads the data of Soft1 directly and feeds the dashboards, with no Excel exports.
Polaris for Atlantis
For the Atlantis ERP of EnterSoftOne
For businesses that still run Atlantis, the older ERP of EnterSoftOne. We have built our own connector for it too, so you do not have to change ERP to have BI.
Delivered through Qlik Sense or Power BI
Qlik Sense
The BI tool of Qlik
We are an official Qlik partner. Polaris includes 17 dashboards and more than 270 indicators and metrics, the same for Soft1 and Atlantis.
Power BI
The BI tool of Microsoft
If your organisation already uses Power BI, we deliver Polaris through it too. The analysis and presentation of the financial data is done in the tool of your choice.
What Polaris offers
Dashboards by section
A detailed presentation of dashboards, metrics & KPIs for every section of the suite.
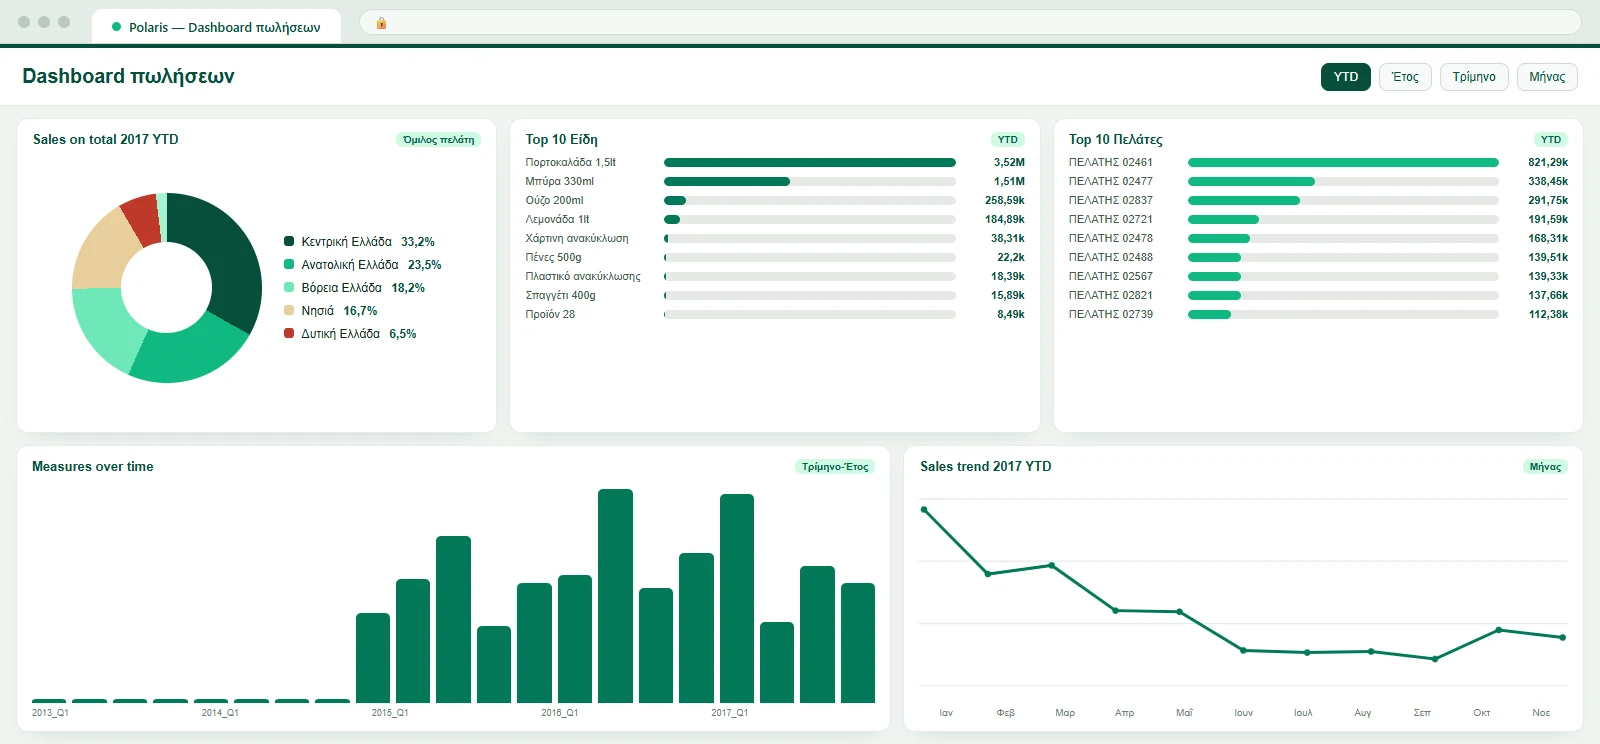
The screens below are from Polaris for Soft1 in Qlik Sense and apply in the same way to Polaris for Atlantis and Power BI. Want to see the dashboards with your own company's data?
Sales
Sales Dashboard
Year-on-year comparison, top items & customers, margin trend, dynamic YTD/MTD/QTD periods
A complete real-time view of sales. Compares value, quantity and profitability against last year and budget, with drill-down to document level.
- Track turnover & profitability
- Compare CY vs LY and vs Budget
- Identify top customers & items
Purchases
Purchases Dashboard
Purchases by supplier & category, CY vs LY comparison, average price
A complete view of purchases by supplier, item category and period. Compares value & quantity against last year and budget and analyzes the average purchase price.
- Track purchase value & quantity
- Compare CY vs LY and vs Budget
- Analyze top suppliers
Inventory
Inventory Overview
Value, turnover, DIO, inbound/outbound & non-moving items
Detailed information on stock status: balance value, inbound/outbound, production cost, DIO (Days Inventory Outstanding), turnover and identification of non-moving items.
- Track stock value & quantity
- Identify dead stock & non-moving items
- Analyze turnover & DIO
Expenses
Expenses Dashboard
Expense analysis based on ABC lines, Actual vs Budget, distribution by category, trend
Detailed information on all operating expenses. Compares Actual vs Budget and vs last year, analyzes distribution by expense category / cost center and flags categories exceeding budget.
- Track expenses vs Budget
- CY vs LY comparison per category
- Spot budget overruns
Collections
Collections Dashboard: Credit Control
Collections across two periods, age of receivables, delays, CEI, matched collections
Compares collections across two arbitrary periods. Measures age by receipt, due or payment date, delays and matched collections. Ideal for checking the effectiveness of collection actions.
- Compare collections of two periods
- Track age & delays
- Analyze matched collections
Finance
Customer Financial Overview
Balances, overdue, pending securities, DSO, aging buckets & CEI
A full view of open balances: balance, open amount, overdue, pending securities, DSO and aged balances per customer. Ideal for cash-flow and credit-policy control.
- Track open balances
- Spot overdue receivables
- Aging bucket analysis (0-30/31-60/61-90/>90)
Financial Management
Cash Flow Statement
Cash movements by activity, category & month
Analyzes actual cash movements by activity (Financing / Operating), movement type and category (Cheques, Payroll, Suppliers etc.), with Cash Movement, Closing and Opening Balance.
- Analyze movements by activity & category
- Compare Opening/Closing Balance per period
- Oversee inflows & outflows from the trial balance
Customers
Customers Dashboard
Turnover, RFM segmentation, retention, turnover concentration, new vs lost customers
Full customer-base analysis: combines commercial data (turnover, profitability) with RFM segmentation (Champions/Loyal/At-risk/Lost), retention analysis and a profitability scatter to spot unprofitable customers.
- RFM segmentation of the customer base
- Track retention & churn
- Spot new, lost & at-risk customers
Suppliers
Suppliers Dashboard
Purchase value, DPO, payables aging, price evolution & purchase concentration
A detailed view of the supplier base: commercial purchase data (value, prices, DPO) combined with finance (payables aging, overdue) and a bullet chart of price evolution per category against last year.
- Analyze top suppliers by value
- Track DPO & payables aging
- Price evolution per category vs last year
Advanced KPIs
ABC Analysis
Pareto 80/15/5, stock value & turnover per class
Ranks items into class A (80% of turnover), B (15%) and C (5%) by Pareto. Finds C-class dead stock for phase-out and analyzes contribution per item category.
- Find items that bring 80% of turnover
- Dead-stock analysis for phase-out
- Optimize inventory management
Plans that scale with you
For an offer, and for Polaris for Atlantis or for Power BI, contact us.
For an offer, and for Polaris for Atlantis or for Power BI, contact us.
Frequently asked questions about Polaris
It is the Business Intelligence solution of Updata Solutions on top of your ERP: ready dashboards and indicators for management, with a direct connection to the data of the ERP. It includes 17 dashboards and more than 270 indicators, the same for Soft1 and Atlantis.
Two ERP of EnterSoftOne: Soft1 (Polaris for Soft1) and Atlantis (Polaris for Atlantis), the older ERP of the company. We have our own connector for each.
Polaris can be delivered through Qlik Sense of Qlik or Power BI of Microsoft, as you prefer. We are an official Qlik partner.
Directly from the ERP through our connector, with no Excel exports and no manual merging of files. It refreshes on a schedule, so the dashboard shows what the business is doing today.
For Polaris for Soft1 in Qlik Sense the licence is a one-off price, with yearly support, and depends on the modules you choose (Commercial Analysis, Commercial and Financial, or the full package). Qlik Sense Cloud (Analyzer) users are charged per user per year, with a minimum of 3 users. For an offer, and for Polaris for Atlantis or for Power BI, contact us.
For management, finance, sales, and purchasing or supply chain. Each role sees the figures it needs, with drill-down to the document.
Yes. Polaris supports several companies from the same or from different SQL databases, and several languages.
Yes. It is web based and the reports adapt automatically to desktop, tablet and phone.
Ready to see your data clearly?
See what an integrated BI dashboard on your own data looks like.